Summary
Overview
This is the screen you would land to after you are done with the integration and every time you login. This gives you a complete picture of every important thing happening in your app. Be it your web app, mobile app or any other channel, you get a single view of the customer across all channels. Let’s know them in detail:
- 1.
Active Users:
We define active users as the users who have opened the app at least once in the selected date range. This section shows the total number of active users along with their distribution based on location and platforms. You can see the counts on the different sections of the map to know location based active user distribution. Currently, we are showing active users based on iOS, Android, Windows and Others(Linux, Web, MacOS etc.) If you have integrated our SDK in your app and not able to see Active Users then check if you have enabled the app Session tracking while integrating the SDK.
- 2.
User Statistics:
In this section, you can see the performance of the top metrics in your app in the selected two months such as Avg Session Time, no of new users, no of returning users, and the total users. This is helpful in getting a quick glampse of the numbers that matter the most. -

- 3.
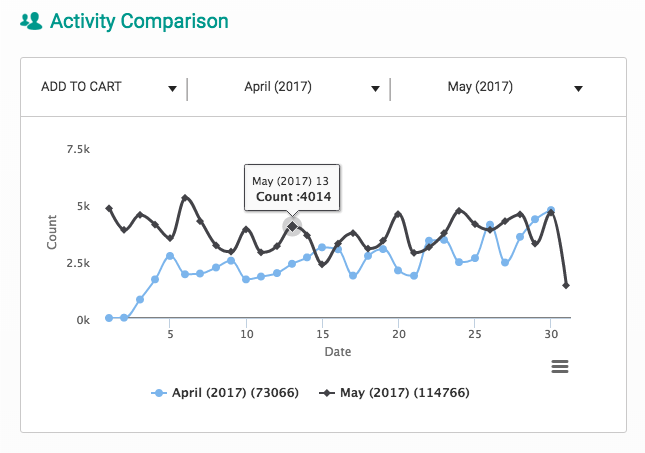
Activity Comparison:
This section allows you to compare an event analytics between any two months. This helps in gauging the increment or decrement in the times that particular event has been triggered. -
- 4.
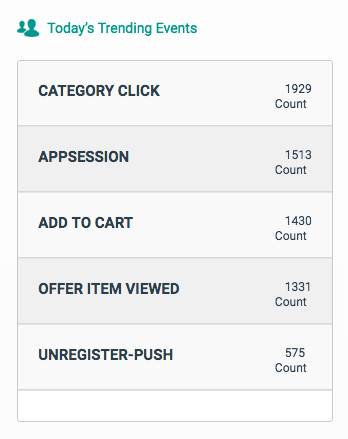
Today’s Trending Events:
Here you get a view of the top events that have been triggered on the current day. It helps them in taking quick business decisions to target users based on current user activity trends. -
- 5.
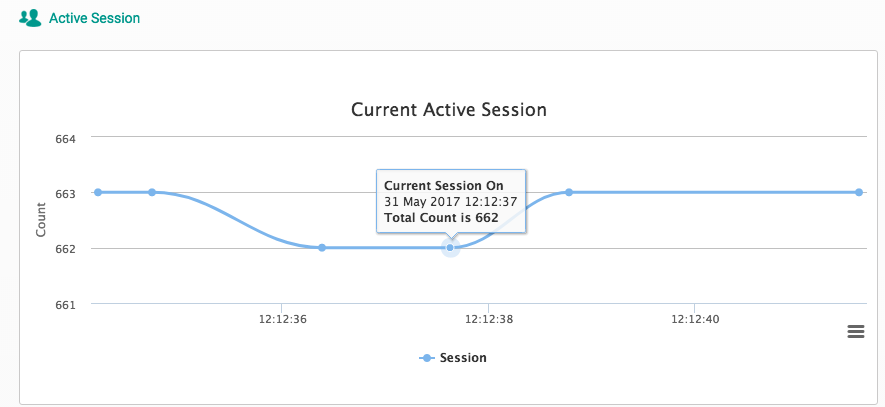
Active Session:
This gives you an accurate information on the current active users in real-time. Let’s say you want to launch a campaign, for instance, in-app campaign, you can figure out the estimated users who would be available at that moment to see your message. -
- 6.
Event Distribution:
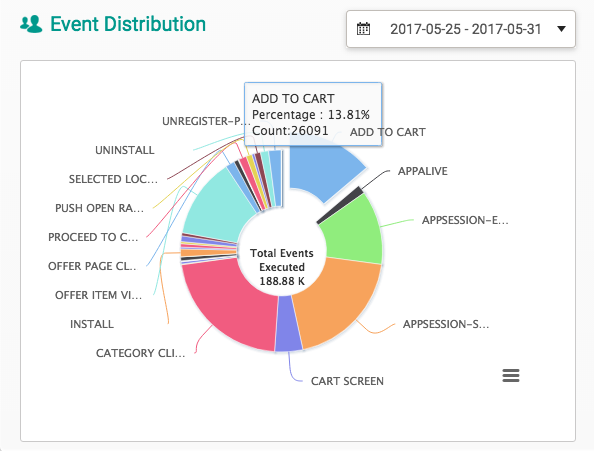
You may wish to have a single view of all the events triggered in a given date range, this section allows just that. This will show you a Pie-Chart which contains contribution of individual events in terms exact count and percentage of total count. -
- 7.
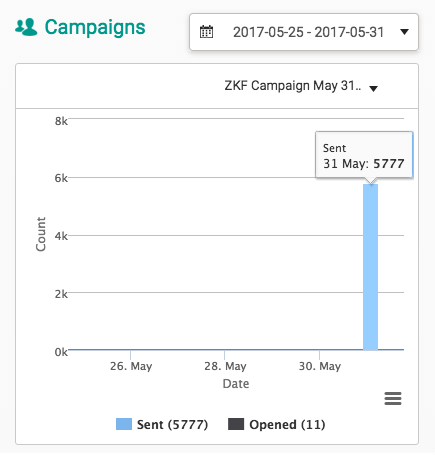
Campaigns:
If you are running multiple campaigns then instead going to the campaign sections to track the performance of each campaigns individually, you can select any of your campaigns here and check out its effectiveness. 